
If you’ve ever built a retrieval-augmented generation (RAG) system using embeddings and vector databases, you already know the drill: you turn your data into vectors, stuff them into a store like FAISS, and let your model retrieve similar chunks during inference. And it works, until it doesn’t. W
If you’ve ever built a retrieval-augmented generation (RAG) system using embeddings and vector databases, you already know the drill: you turn your data into vectors, stuff them into a store like FAISS, and let your model retrieve similar chunks during inference.
And it works, until it doesn’t.
Why Vector Search Alone Falls Short
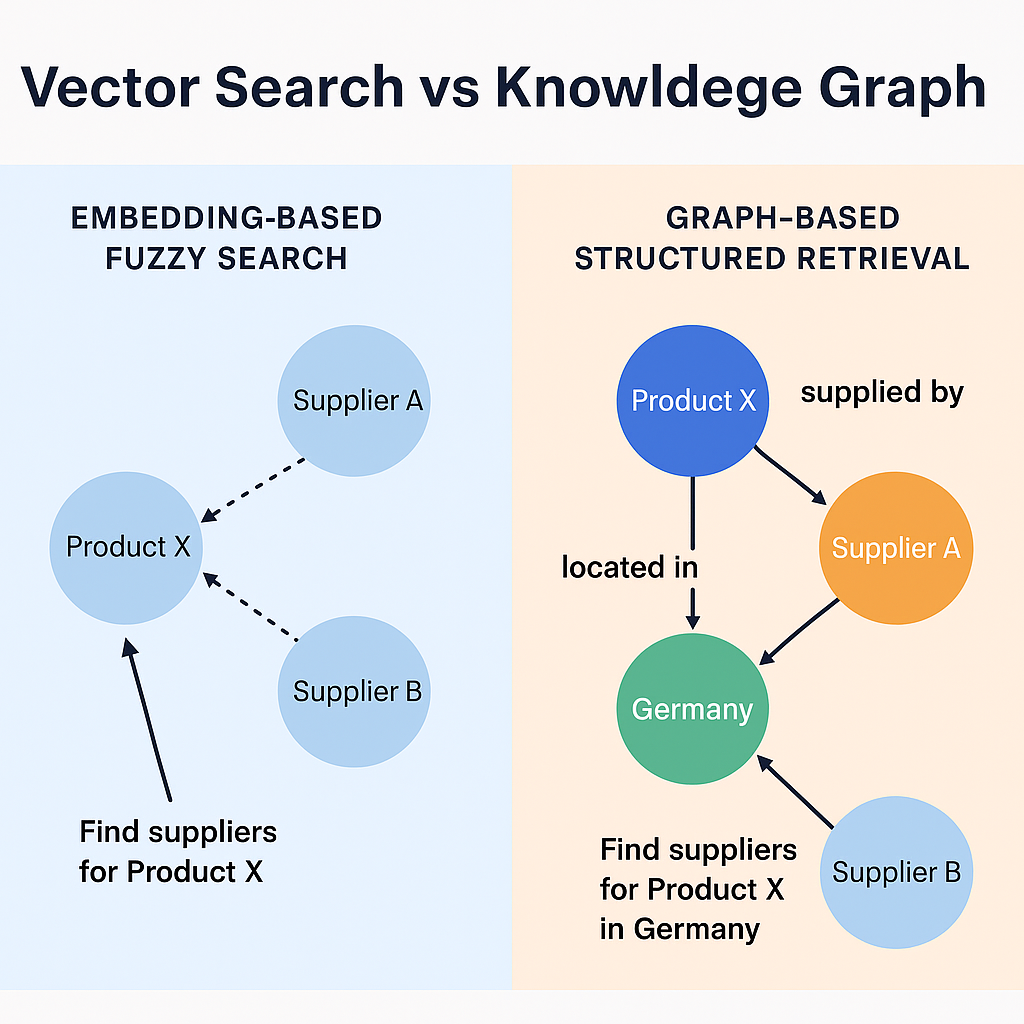
Embeddings are great at catching semantic similarity. But what they don’t give you is structure. They don’t know that “Supplier A ships to Germany” or that “Product X requires a temperature-controlled warehouse.” They don’t understand relationships.
This becomes a real problem when:
- You need to enforce business logic
(e.g., “Only show suppliers who are certified and in the same region”) - You want to combine structured facts with natural text
(e.g., “Summarize my top 5 suppliers in Europe for Product X”) - You need explainability
(e.g., “Why was this supplier recommended?”)
In short, vector search is like a very smart blur, which can be really helpful, but sometimes too vague.
Why Knowledge Graphs Are Catching On
That’s where knowledge graphs come in. Unlike vectors, graphs give you explicit relationships between entities. A product has a supplier. A supplier serves a location. A warehouse stores certain categories. And once that structure exists, querying becomes way more powerful and intuitive.
Here’s what makes knowledge graphs so useful in AI-powered apps:
- Structured retrieval: You can write precise queries instead of relying on fuzzy matches.
- Explainability: You can show exactly why a result was retrieved.
- Domain alignment: Graphs reflect real-world relationships, just like your business rules do.
By the end of this article, you’ll build a working question-answering app that combines knowledge graphs with language models. Specifically:
- You’ll load supply chain data (product catalogs, suppliers, purchase orders)
- Convert unstructured descriptions into structured relationships
- Build a knowledge graph using Neo4j
- Query the graph with user questions like “Which suppliers in Europe provide Product X?”
- Generate natural-language answers based on retrieved graph data
This is a very interesting real-world implementation of knowledge graph-based RAG.
How Knowledge Graphs Work
Working with vector search, you already know that you take some text, embed it into a vector, and then look for other vectors that are close. The moment you need to reason over structured facts, relationships, or apply logic like “filter by supplier region,” vector search starts to feel like duct tape.
That’s where knowledge graphs step in.
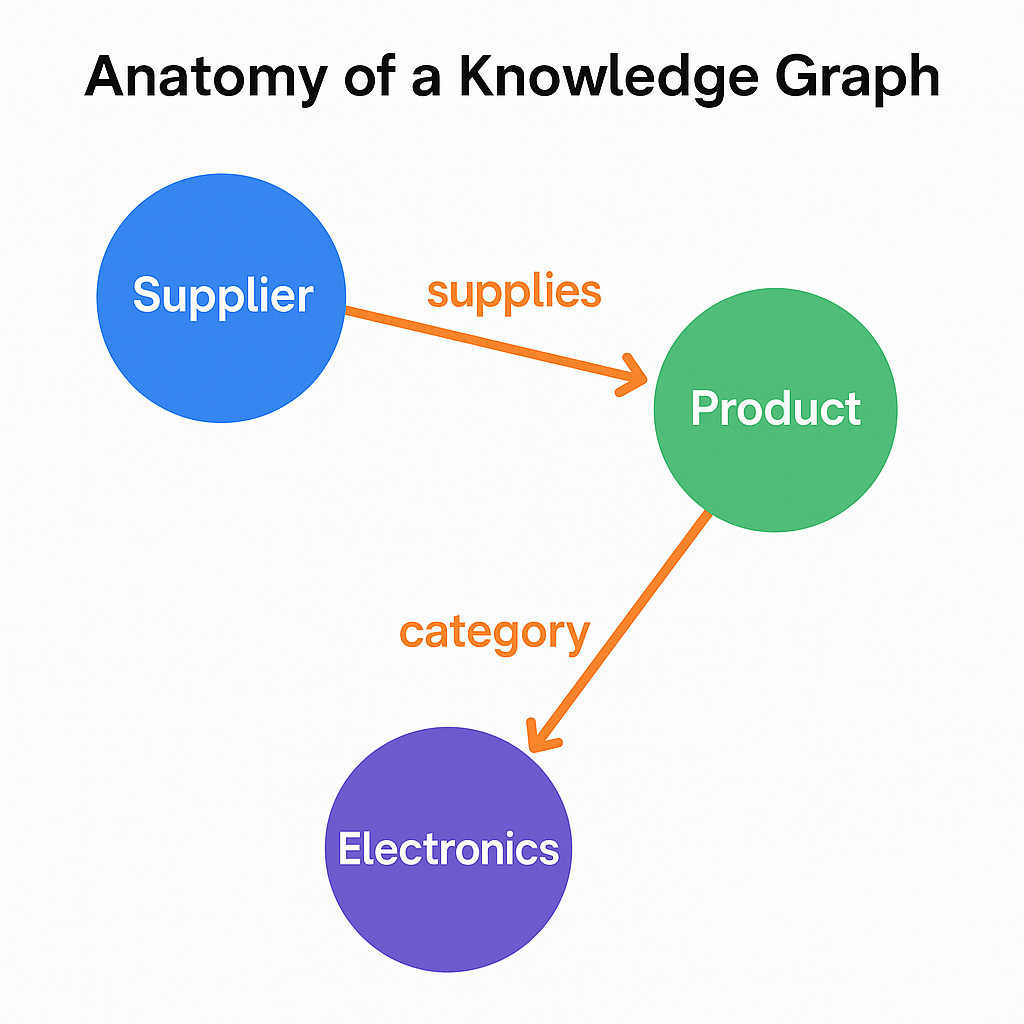
A knowledge graph (KG) is a structured representation of facts. Instead of storing data as documents or raw text, it organizes the world as entities (like “Supplier A” or “Product X”) and relationships (like “supplies” or “located_in”) between them.
The Building Blocks of a Knowledge Graph
At the core, a KG is just a set of triples:
(Entity A) — [Relation] → (Entity B)
For example:
(Supplier A) — [supplies] → (Product X)
(Supplier A) — [located_in] → (Germany)
These triples are stored as nodes and edges, which together form a graph. Each node represents a unique concept or object, while each edge defines how two nodes are connected.
Once you have this graph, retrieval becomes more than just blurry similarity. You can follow paths, apply constraints, and answer precise questions. For instance:
- Which suppliers in Europe provide electronic parts?
- What products did Supplier B deliver last quarter?
The graph understands structure and hierarchy. Because of the nodes and edges, it knows that “Supplier B” is related to certain purchase orders and that “Europe” contains Germany, France, etc.
Why Not Just Use Vectors?
Good question. Vector search engines like Pinecone or Weaviate are powerful for semantic matching. They shine when you’re dealing with natural language, fuzzy synonyms, or vague queries like “cheapest product with fast delivery.”
But they fall short when:
- You need exact business logic (“only suppliers who passed our compliance checks”).
- You want explainability (how did the system decide this was the best answer?).
- You care about relational context (“show suppliers that deliver Product X and are located in Germany”).
With vector embeddings, the relationships between entities are implicit. With knowledge graphs, they’re explicit and that changes everything.
How Knowledge Graphs Power Retrieval
Imagine you get a user query like:
“Which suppliers in Europe provide lithium-ion batteries?”
A knowledge graph can:
- Identify "lithium-ion batteries" as a product.
- Traverse the graph to find all suppliers linked to that product.
- Filter by region to return only those with a located_in relationship pointing to European countries.
And that’s not hypothetical. In the next section, you’ll build exactly that.
Want to learn how memory improves LLM performance? See how Flow built smarter products with Supermemory
By combining graphs and LLMs, you get the best of both worlds: structured, reliable facts with the flexibility of natural language understanding. It’s a big reason why memory-based platforms like supermemory.ai are designed to integrate with both vector and graph retrieval patterns.
Step-by-Step Tutorial: Supply Chain QA with Knowledge Graph RAG
In this section, we will get practical. We will build a local knowledge graph using Neo4j, convert structured CSV fields into knowledge triples using GPT, query the graph to answer domain-specific questions and finally, generate a readable answer using a template.
Step 1. Setup and Install Dependencies
In this section, we will ensure that our local environment is ready for building and querying the Knowledge Graph.
We will need the following:
- Python 3.8+
- Neo4j Desktop (Download it here)
- OpenAI account (for triple extraction)
- Jupyter Notebook or any Python IDE (e.g., VS Code)
- Procurement KPI Analysis Dataset
Open your terminal or notebook and install the following:
pip install pandas py2neo openai neo4j datasets
py2neo is the official library to work with Neo4j in Python, openai helps us make requests to the LLM, and datasets would let us download the Procurement KPI Analysis Dataset listed above.
Step 2. Launch Neo4j
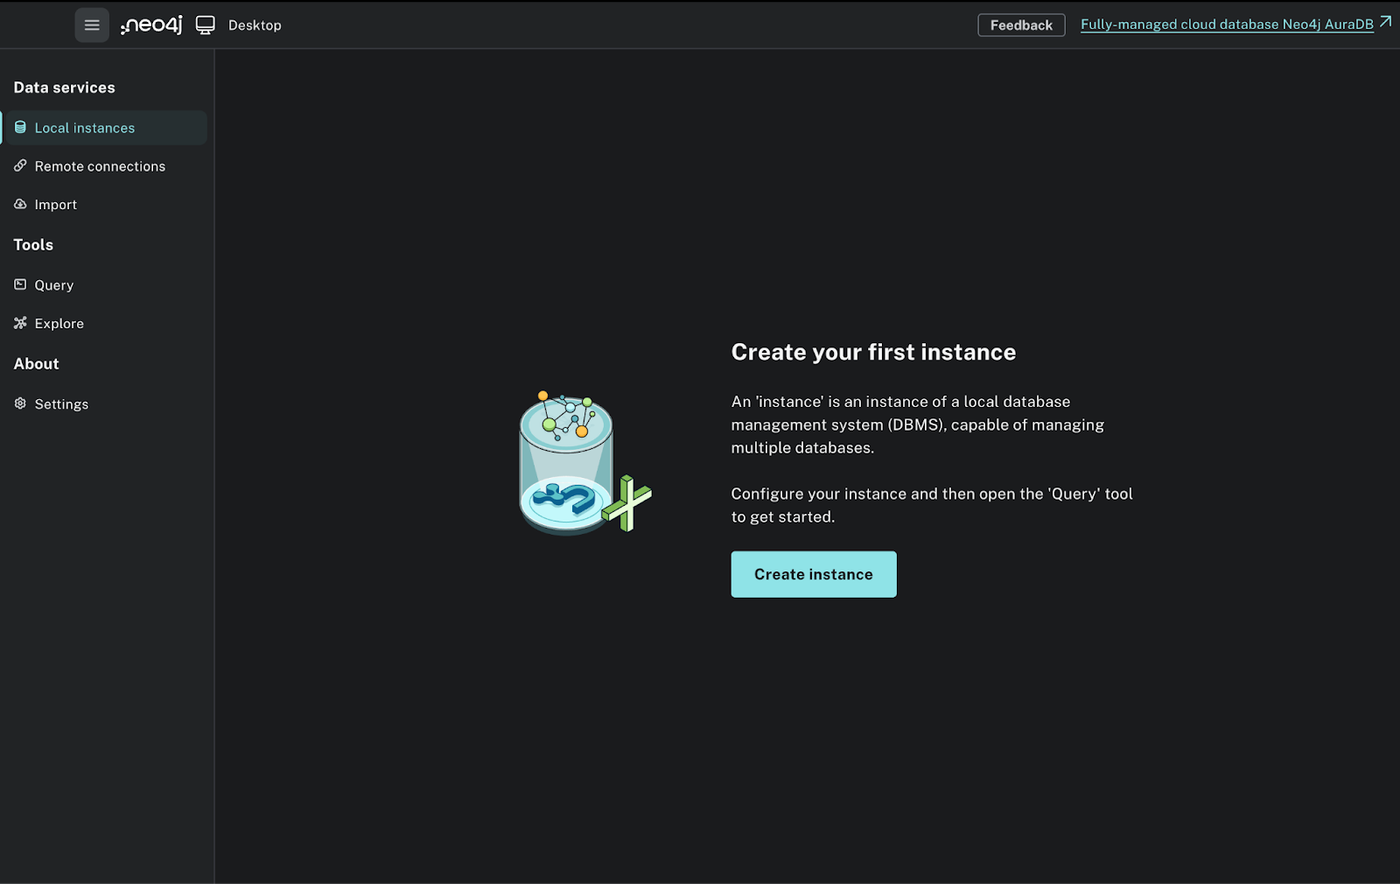
This will prepare Neo4j to accept incoming connections and display the graph. Neo4j is a graph database, designed specifically to store and query data structured as nodes (entities) and edges (relationships). To run the Neo4j desktop locally, you can follow this step-by-step process:
Step 1: Create a New Project
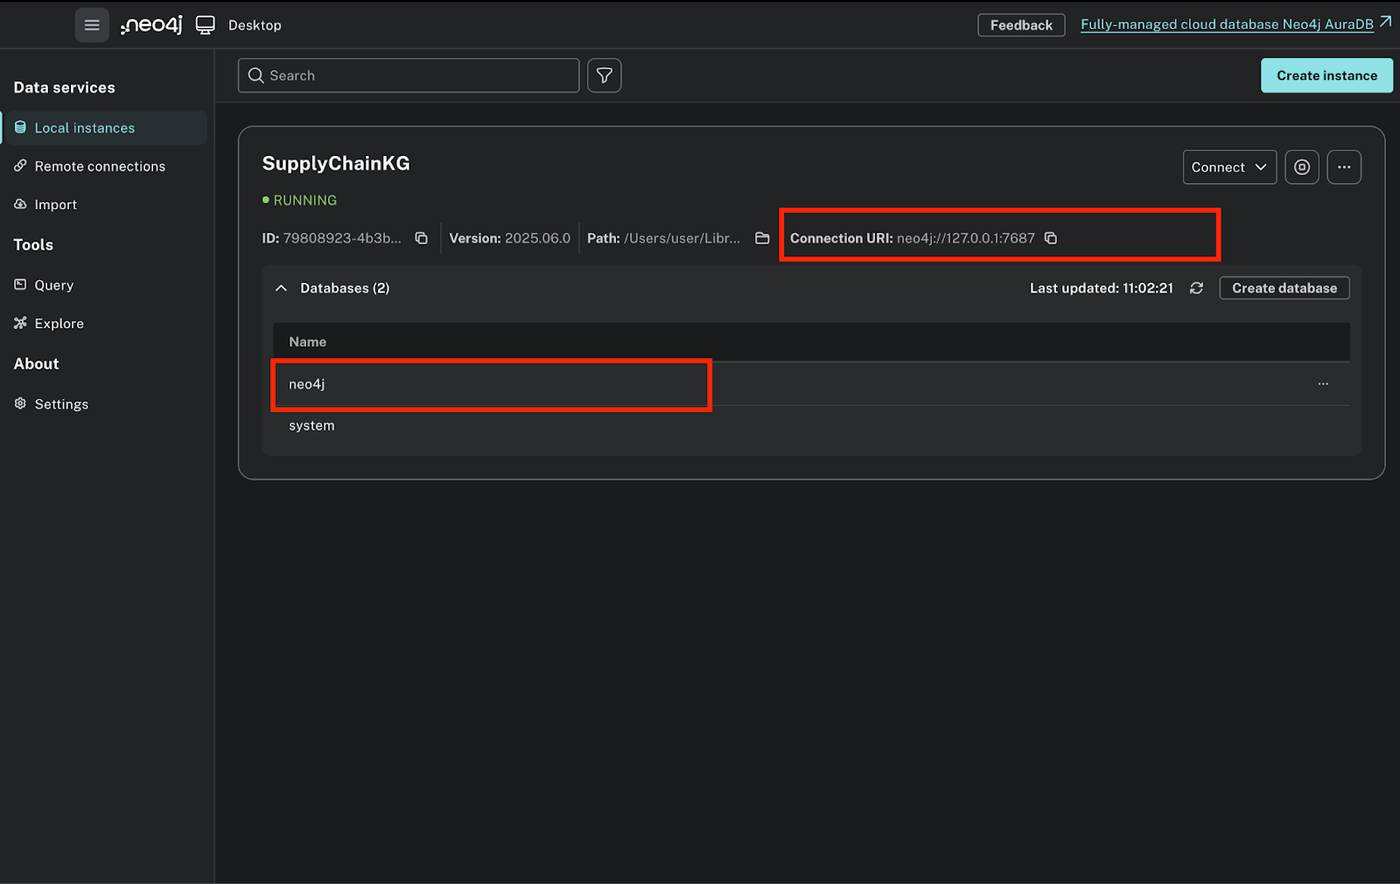
- After this, you will find your local instance running. You’ll need the Connection URI for your Python app to connect. Click on your running DB, where you will be able to find the following:
Create an instance, you can name it SupplyChainKG. Inside the instance, create a database user and send the password(you’ll use this in your code).
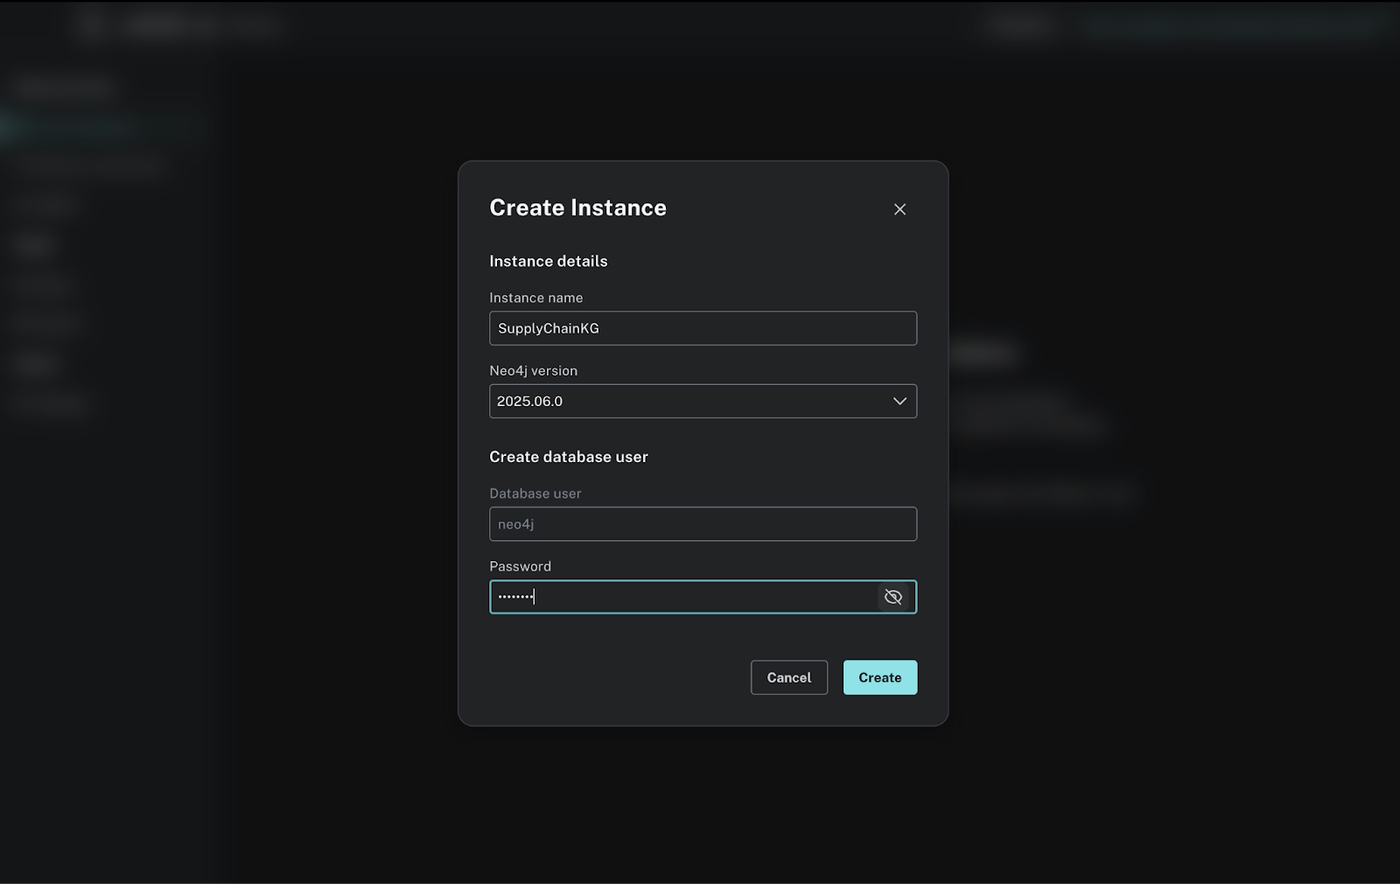
Open Neo4j Desktop
- Connection URI:
neo4j://127.0.0.1:7687 - Username:
neo4j - Password: whatever you set (e.g., test)
Step 3. Import Required Libraries and Connect to Neo4j
Before we build the knowledge graph, we need to import the necessary libraries and connect to a local Neo4j database. Make sure Neo4j is running and your credentials are correct.
import ast
from py2neo import Graph, Node, Relationship # To interact with Neo4j graph

# Connect to your running Neo4j database instance
graph = Graph("neo4j://localhost:7687", auth=("neo4j", "testpassword"))
ast has been used for safely evaluating stringified list of tuples.
Step 4. Define the Graph Construction Function
Our app will work by using GPT to convert the rows in our dataset into strings of triples that we can use to construct nodes and relationships in the graph database. This function takes GPT's response (a string of triples), parses it, and constructs nodes and relationships inside the Neo4j graph.
Each triple is expected to follow the (subject, predicate, object) structure.
Declare a function in your file:
def build_graph_from_gpt_response(gpt_response):
Use a try-catch block inside it to parse the GPT output:
	try:
        # Safely parse the GPT response (which is a string of list of tuples)
        triples = ast.literal_eval(gpt_response)
    except Exception as e:
        print("Parsing Error:", e)
Awesome, now let's extract the subject, predicate, and object from the GPT output and convert it to a graph as follows:
	for triple in triples:
    # Ensure the triple is valid and contains exactly 3 items
        if len(triple) != 3:
            continue
        # Strip and convert all parts to string (to avoid TypeErrors)
        subject, predicate, obj = [str(x).strip() for x in triple]

        # Create graph nodes for subject and object
        subj_node = Node("Entity", name=subject)
        obj_node = Node("Entity", name=obj)

        # Create the relationship between the nodes
        relationship = Relationship(subj_node, predicate, obj_node)

        # Merge ensures no duplicates; updates if nodes/edges exist
        graph.merge(subj_node, "Entity", "name")
        graph.merge(obj_node, "Entity", "name")
        graph.merge(relationship)
The loop only executes if the tuple has exactly 3 entities. Using the strip() function, the entites are extracted.
Nodes are constructed for the subject and object, wherease the predicate is used to create a relationship, and these are merged into the graph.
Step 5. Import OpenAI and Load Dataset
We'll use the OpenAI API to extract structured knowledge from rows in the procurement CSV dataset. We’re using a Procurement KPI Analysis Dataset because it includes product, supplier, pricing, and compliance information.
import pandas as pd
from openai import OpenAI # Ensure you've installed the OpenAI package

# Initialize OpenAI client with your API key
client = OpenAI(api_key="OPENAI_API_KEY")

# Load the Procurement KPI Analysis Dataset
df = pd.read_csv("Procurement KPI Analysis Dataset.csv")
Initialize the OpenAI client with your OpenAI API Key and make sure you've downloaded the CSV from the link and stored it in the same folder as the file you're writing the code in.
Step 6. Loop Over a Few Rows and Send Them to GPT
We'll use GPT to extract subject-predicate-object triples from 3 sample rows in the dataset. Once you confirm that it's working, you can increase the number of rows.
Now we loop through a few rows of the dataset, construct a GPT prompt for each, extract triples, and pass them to the graph builder.
for i in range(5): # Start with 5 rows
row = df.iloc[i]
# Clear prompt with structure and examples
prompt = f"""
Extract subject-predicate-object triples from the following structured purchase order. Return the result as a valid Python list of 3-item tuples. Use proper literals — avoid vague terms like 'N/A'.
Example format:
[
("Delta Logistics", "supplies", "Raw Materials"),
("Raw Materials", "has_quantity", "1180"),
("Raw Materials", "has_price", "64.07")
]
Purchase Order:
Supplier: {row['Supplier']}
Item Category: {row['Item_Category']}
Quantity: {row['Quantity']}
Unit Price: {row['Unit_Price']}
Order Status: {row['Order_Status']}
Compliance: {row['Compliance']}
I need this to construct a knowledge graph from the data in the spreadsheet. Please ensure the triples are accurate and complete, reflecting the relationships in the purchase order.
"""
# Send prompt to GPT
response = client.chat.completions.create(
model="gpt-3.5-turbo",
messages=[{"role": "user", "content": prompt}],
temperature=0
)
content = response.choices[0].message.content.strip()
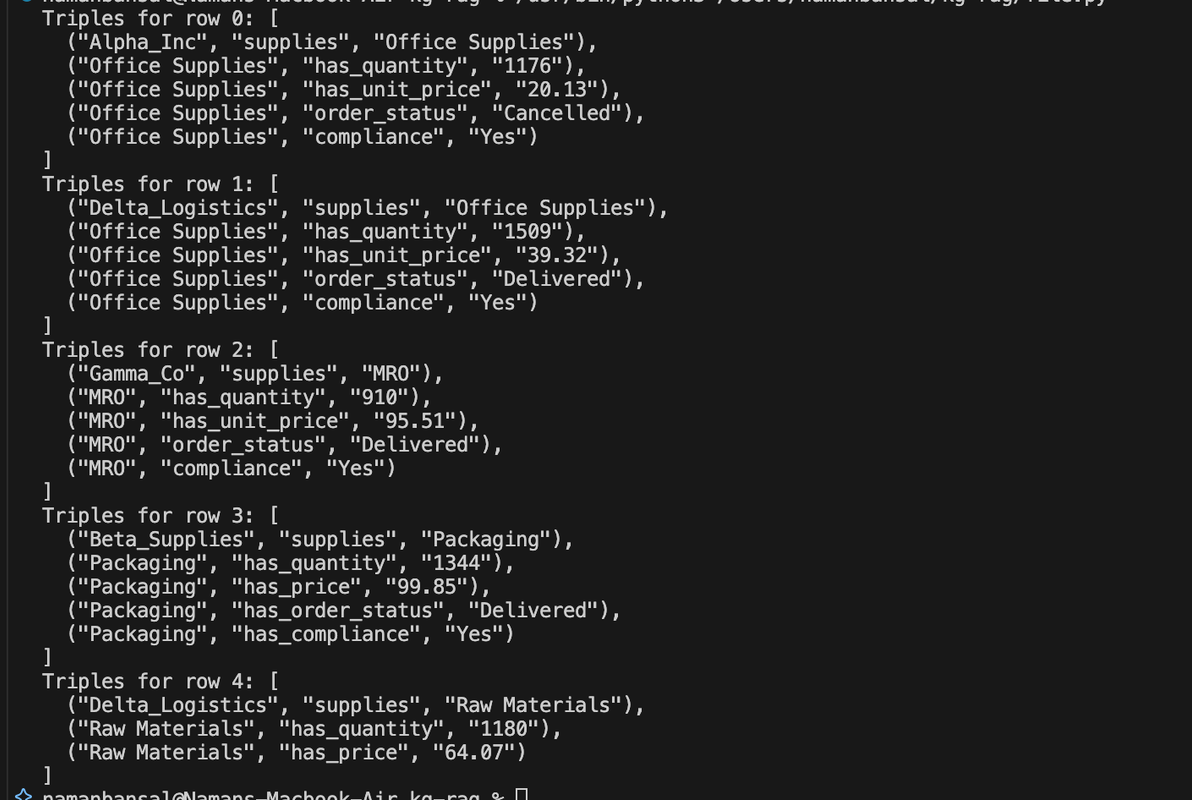
print(f"Triples for row {i}:", content)
# Build graph from the returned triples
build_graph_from_gpt_response(content)
You should get an output that looks like this:
Step 7: Querying the Knowledge Graph for Answers (RAG)
Now we test a natural language question: "Which suppliers provide Raw Materials?"
Neo4J provides their own graph query language called Cypher which we'll use to run this natural language query as follows:
question_query = """
MATCH (s:Entity)-[:supplies]->(c:Entity {name: "Raw Materials"})
RETURN s.name AS supplier
"""

# Run the Cypher query
suppliers = graph.run(question_query).data()
print("Suppliers of Raw Materials:", suppliers)
Round brackets are used to represent (:Nodes) and -[:ARROWS]-> represent relationships between the nodes. In the above query, we check for nodes that have the label "Entity", which supply to other nodes labelled "Entity" with the name "Raw Materials".
The output is as follows:

Step 8: Generate a Natural Language Answer
You can turn the Cypher output into human-readable text — a critical part of the RAG pipeline.
def format_answer(suppliers):
    if not suppliers:
        return "No compliant suppliers found for Raw Materials."
    names = [s["supplier"] for s in suppliers]
    return f"The following compliant suppliers provide Raw Materials: {', '.join(names)}."

# Print final answer
print(format_answer(suppliers))
The function simply access the array of objects that the graph returns, extracts the name of the supplier from it, and appends it to a string.
Step 9. Visualizing the results in Neo4j Desktop
Go to Neo4j Desktop and click on Query. Select your instance, and then run the queries in the text box provided.
First, let's check the number of nodes in our database with this query:
MATCH (n) RETURN COUNT(n);
Output:
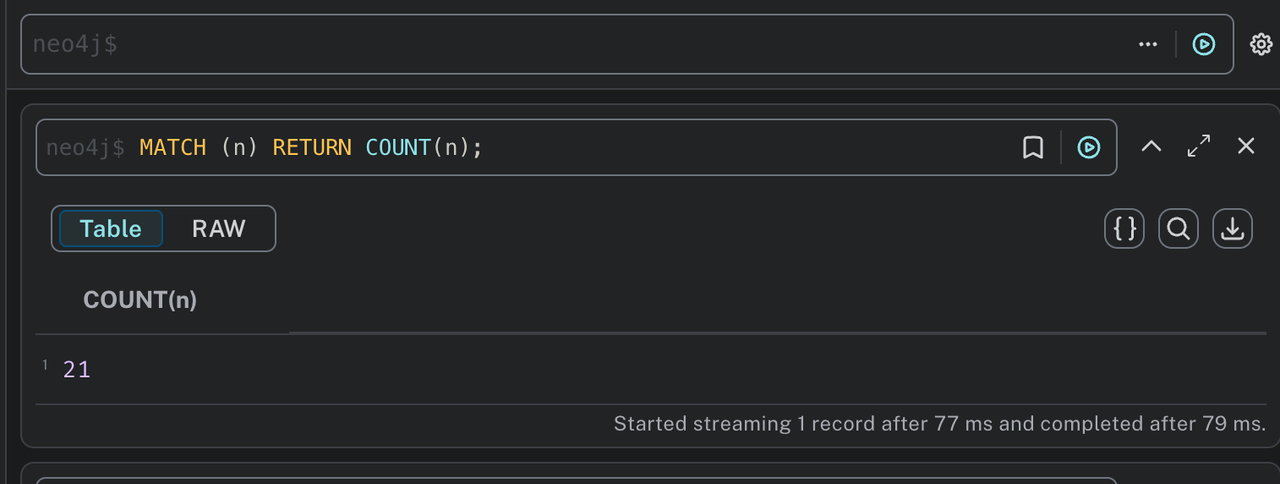
You should see a number > 0 in this case, we have 21
If you want to check for a sample of how the data is stored, run the following:
MATCH (a)-[r]->(b) RETURN a.name, type(r), b.name LIMIT 10;
Output:
![Neo4j table result of MATCH (a)-[r]->(b) showing relationships like Alpha_Inc supplies Office Supplies](https://cdn.sanity.io/images/zw7klfyk/production/2d4302efc227c3ff911b1a6b8c7f2cf9230deb9e-1033x800.png?w=1400&fit=max&auto=format)
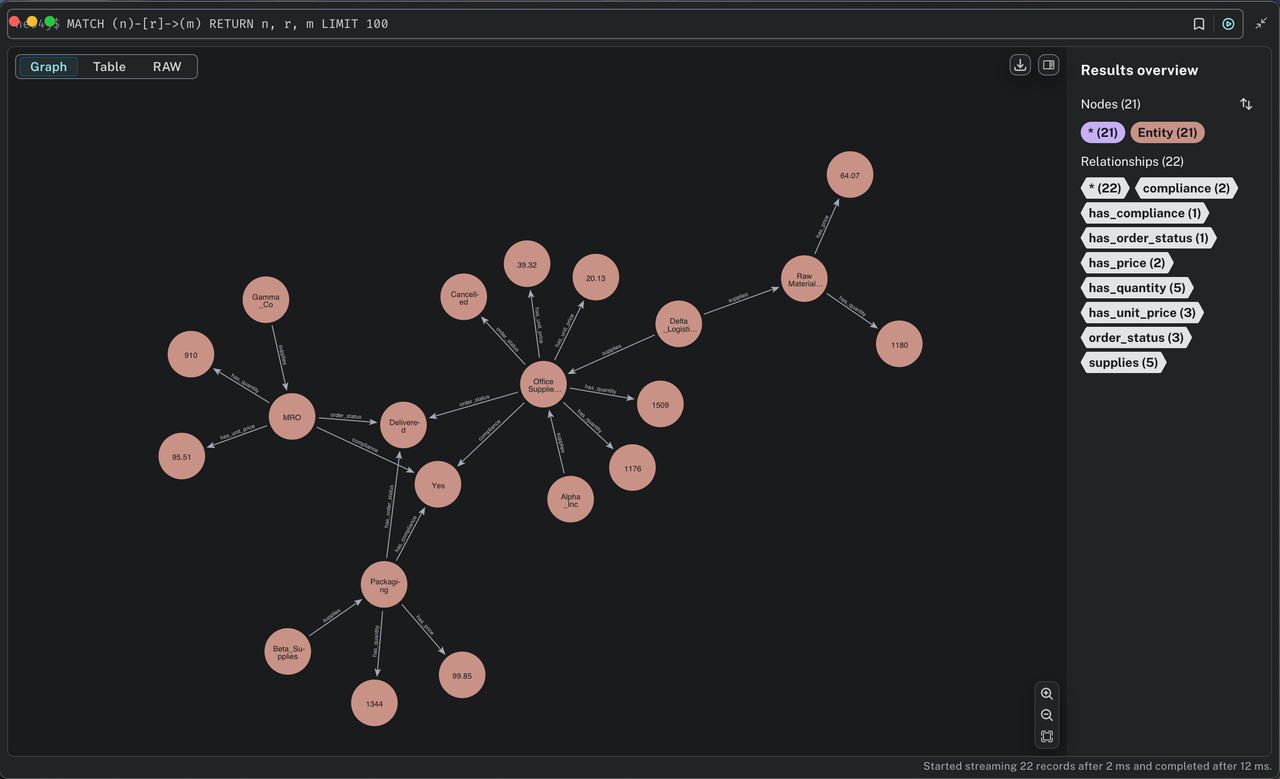
To see the entire graph visualized: entities as circles, relationships as arrows, run this cypher:
MATCH (n)-[r]->(m) RETURN n, r, m LIMIT 100
How Do You Measure Knowledge Graph Quality?
Building a knowledge graph is great. But how do you know if it’s actually any good?
This is where a lot of beginner AI engineers hit a wall. The graph looks fine, maybe even visualizes nicely in Neo4j, but under the hood, it could be missing key connections, introducing wrong relationships, or lacking coverage. And if you're plugging that graph into a retrieval-augmented generation (RAG) system, a weak graph means weak answers.
So let’s break down the core ways to evaluate the quality of your knowledge graph, especially the one we just built for the supply chain question-answering use case.
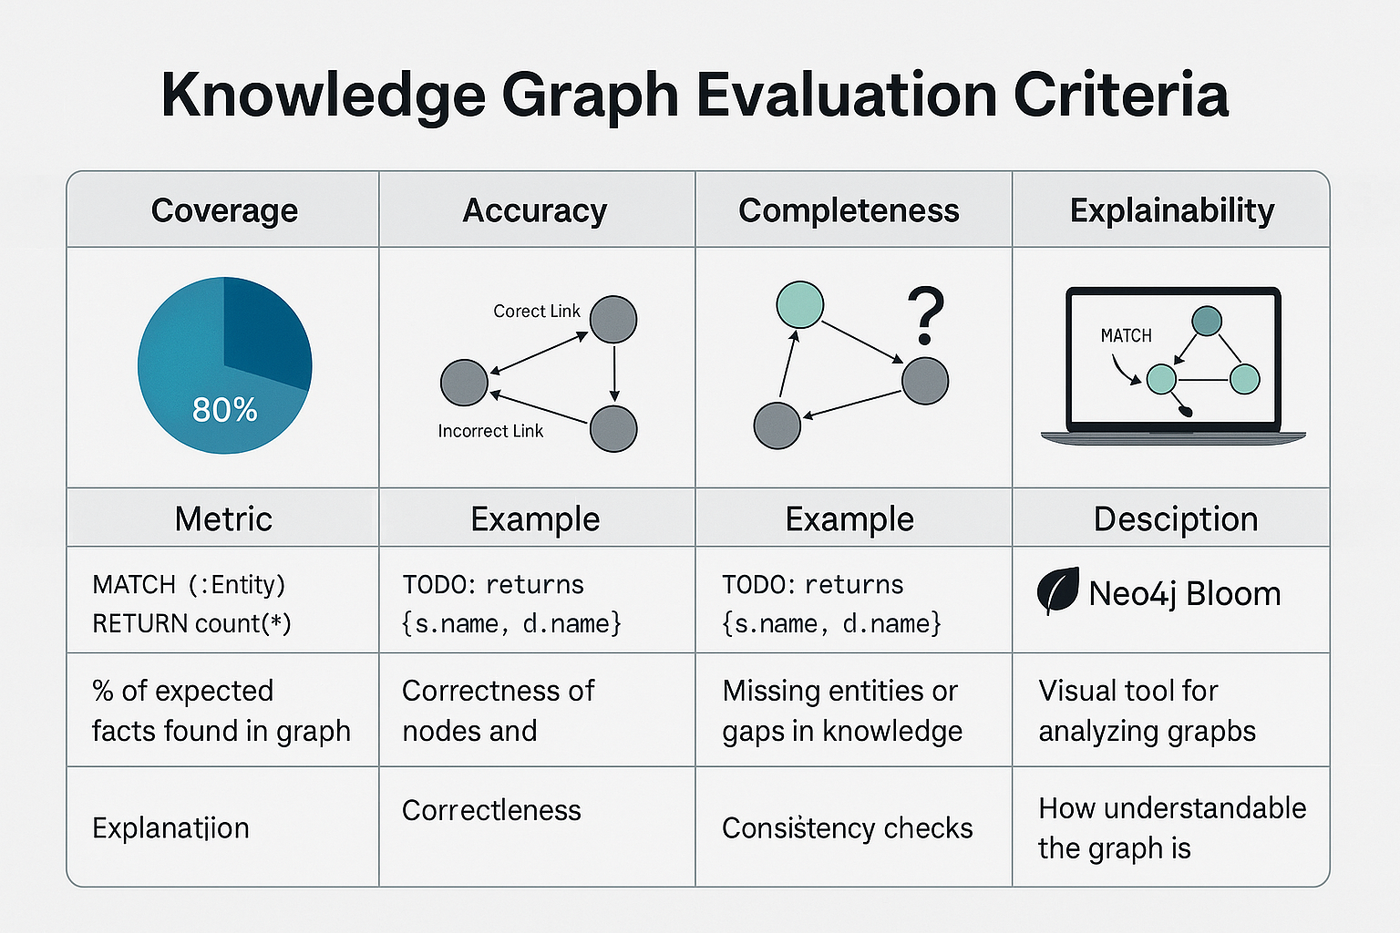
Coverage
Coverage refers to how much of the actual data your graph managed to capture in the form of nodes and edges. If your dataset contains 100 suppliers but only 40 show up as nodes in the graph, you're leaving insight on the table.
You can calculate this manually by comparing the number of entities/relations in your source data versus the ones that made it into the graph.
# Total number of unique suppliers in the CSV
total_suppliers = df['Supplier'].nunique()

# How many of those suppliers exist as named nodes in the graph?
query = """
MATCH (s:Entity)
WHERE EXISTS {
  MATCH (s)-[]->()
}
RETURN count(DISTINCT s.name) AS linked_suppliers
"""
linked_suppliers = graph.run(query, parameters={"supplier_list": df['Supplier'].dropna().unique().tolist()}).data()[0]['linked_suppliers']
coverage_percent = (linked_suppliers / total_suppliers) * 100

print(f"Supplier Node Coverage: {coverage_percent:.2f}%")
Why does this matter? Low coverage means your graph can’t support many types of queries, it limits what your app can answer.
Accuracy
Accuracy means the relationships in the graph are actually correct. For instance, if “Delta Logistics” is shown supplying “Office Supplies” when they really supply “IT Equipment,” that’s a faulty edge.
To check for accuracy, spot-check your triples. A good practice is to manually review a subset of extracted triples and compare them with the original row in the dataset. If you’ve extracted 10 triples from GPT, verify if each subject-predicate-object makes sense contextually.
sample_check = graph.run("""
MATCH (a:Entity)-[r]->(b:Entity)
RETURN a.name AS subject, type(r) AS relation, b.name AS object
LIMIT 10
""").to_data_frame()

print(sample_check)
Completeness
A graph can be accurate and still incomplete. Completeness checks whether all relevant connections were extracted and represented.
Checking this is trickier because it often involves domain knowledge. For example, if your business rule says every supplier must have a “compliance” rating, but your graph has some suppliers without any compliance edges, you’ve got gaps.
# Find suppliers without compliance links
query = """
MATCH (s:Entity)
WHERE NOT (s)-[:Compliance]->()
RETURN s.name AS MissingCompliance
"""

missing_compliance = graph.run(query, parameters={"supplier_list": df['Supplier'].dropna().unique().tolist()}).to_data_frame()
print(missing_compliance)
Explainability
One of the strongest benefits of knowledge graphs over vector search is explainability. Can you trace a clear path between entities? Can you see why a fact was returned?
To check for this, fire up Neo4j Bloom and inspect the subgraphs visually. When you ask a question like “Which non-compliant suppliers provide raw materials?”, can you see the chain of edges that explain the result?
Alternatively, export a few subgraphs and explain them in plain English. That’s a human-readable test of graph logic.
You can get more scientific with:
- Precision & Recall for named entity recognition (NER) and relation extraction (RE) stages — if your pipeline does this
- Manual Subgraph Audits: Pick 10 nodes at random and audit their relationships
- Consistency Checks: No dangling edges, no duplicate nodes with the same label, etc.
If you want to go deeper, here are some tools that can be of help:
- Neo4j Bloom: Perfect for graph exploration without writing queries
- Evaluation scripts: Write custom Python scripts that check for coverage, duplicate edges, or logical inconsistencies
How Good Is the Knowledge Graph We Built?
Now that you've built our graph using Neo4j and GPT-generated triples, we can test it in real time. Using this code:
# What % of suppliers in CSV have at least one edge in the graph?
total_suppliers = df['Supplier'].nunique()

query = """
MATCH (s:Entity)
WHERE EXISTS {
MATCH (s)-[]->()
}
RETURN count(DISTINCT s.name) AS linked_suppliers
"""

linked_suppliers = graph.run(query).data()[0]['linked_suppliers']
coverage_percent = (linked_suppliers / total_suppliers) * 100

print(f"Supplier Node Coverage: {coverage_percent:.2f}%")
Here is our result:

If you’re getting low numbers, maybe GPT missed some triples or they weren’t added due to formatting errors, and that is your signal to iterate.
Conclusion
Knowledge Graph RAG is a real-world solution when vector search alone doesn’t cut it. If you’ve ever struggled to answer structured questions or enforce logic across messy data, this combo brings sanity and structure to your pipeline.
And the best part? You don’t have to build it all from scratch.
Supermemory gives you plug-and-play memory APIs that support both vector and graph-style retrieval, with built-in evaluation, flexible integrations, and long-term memory that scales. Whether you’re working with PDFs, emails, supply chains, or anything in between, it just works.
Ready to build smarter AI memory? Start here.


